Authors: Satoshi Tsutsui and David Crandall.
Abstract
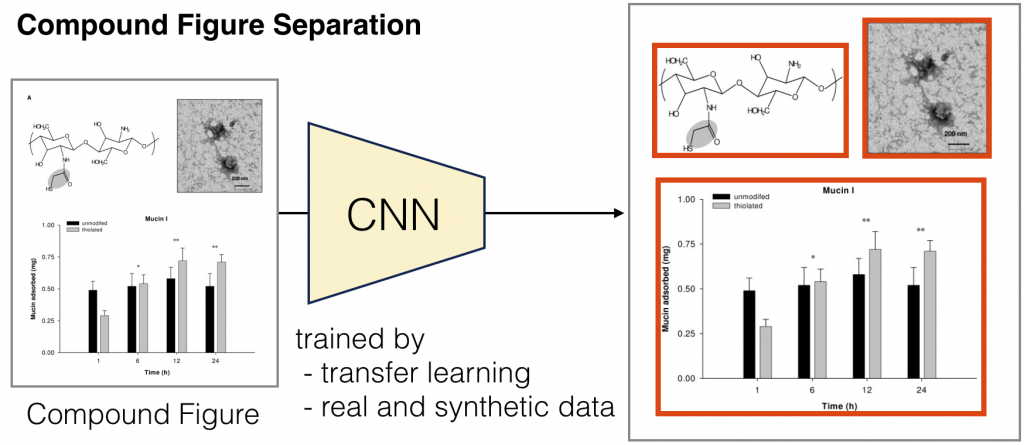
A key problem in automatic analysis and understanding of scientific papers is to extract semantic information from non-textual paper components like figures, diagrams, tables, etc. This research always requires a very first preprocessing step: decomposing compound multi-part figures into individual subfigures. Previous work in compound figure separation has been based on manually designed features and separation rules, which often fail for less common figure types and layouts. Moreover, no implementation for compound figure decomposition is publicly available.
This paper proposes a data driven approach to separate compound figures using modern deep Convolutional Neural Networks (CNNs) to train the separator in an end-to-end manner. CNNs eliminate the need for manually designing features and separation rules, but require large amount of annotated training data. We overcome this challenge using transfer learning as well as automatically synthesizing training exemplars. We evaluate our technique on the ImageCLEF Medical dataset, achieving 85.9% accuracy and outperforming manually engineered previous techniques. We made the resulting approach available as an easy-to-use Python library, aiming to promote further research in scientific figure mining.
Resources
– Github code and pre-trained model: https://github.com/apple2373/figure-separator
— easy to use figure separator!
– Preprint of the paper: https://arxiv.org/abs/1703.05105
– Citation: If you use the figure separator in your research or found it useful, please consider to cite:
@inproceedings{figure-separate,

title={{A Data Driven Approach for Compound Figure Separation Using Convolutional Neural Networks}},

author={Satoshi Tsutsui, and David Crandall},

booktitle={{The IAPR International Conference on Document Analysis and Recognition (ICDAR)}},

year={2017}

}
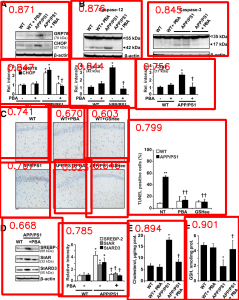
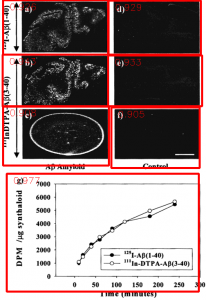
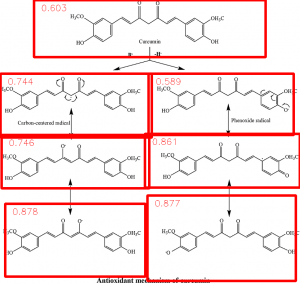
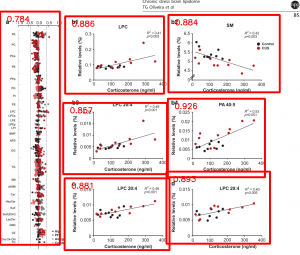
Examples